Sending your Threat Indicators to Azure Sentinel
How and why should you send your threat indicators to Azure Sentinel or add them manually to the Microsoft Defender Advanced Threat Protection (MDATP) solution? What is an indicator, also known as an Indicator of Compromise (IoC)? Why should you care? How can you do this? Let’s go through this and add indicators manually and by using a Logic App and the Microsoft Graph Security API.
First, we will take a look into what an Indicator is and how it works in MDATP to get a better understanding of what we are dealing with. Then send the indicator to Azure Sentinel through the Microsoft Graph Security API.
What is an indicator?
An IoC is a piece of evidence that could indicate you have malicious activity in your environment. This can have many forms i.e.:
- File hashes
- Network activities
- Ip address or URL’s
The IoC on its own doesn’t necessarily mean you have been compromised. Often the combination of file hashes, network activity, and origin (IP or Url) are the providers of context which in turn determines if it is a threat. For more info, you can have a look at the Mitre ATT&CK framework here. This is a framework to describe what tactics and techniques are used to identify and defend against attacks on your organization.
This is all good and fine but what if you encounter an application on one of your managed devices and want to block it for the entire organization? Take for example an Android application (.apk) that is not detected by MDATP at the moment. As we all know these applications can also have malware in them or download other applications. One of your users sends it to another and another and so forth. How can you stop this? By adding the file hash of the APK to the indicators in MDATP. This will stop the spreading of the file and allow you to further investigate it.
Add an indicator manually
Let’s go to the MDATP portal and sign in. To get to the Indicators page we first have to go to Settings in the left menu and then to the indicators page. Here you have an overview of all your indicators. This should look like the portal below
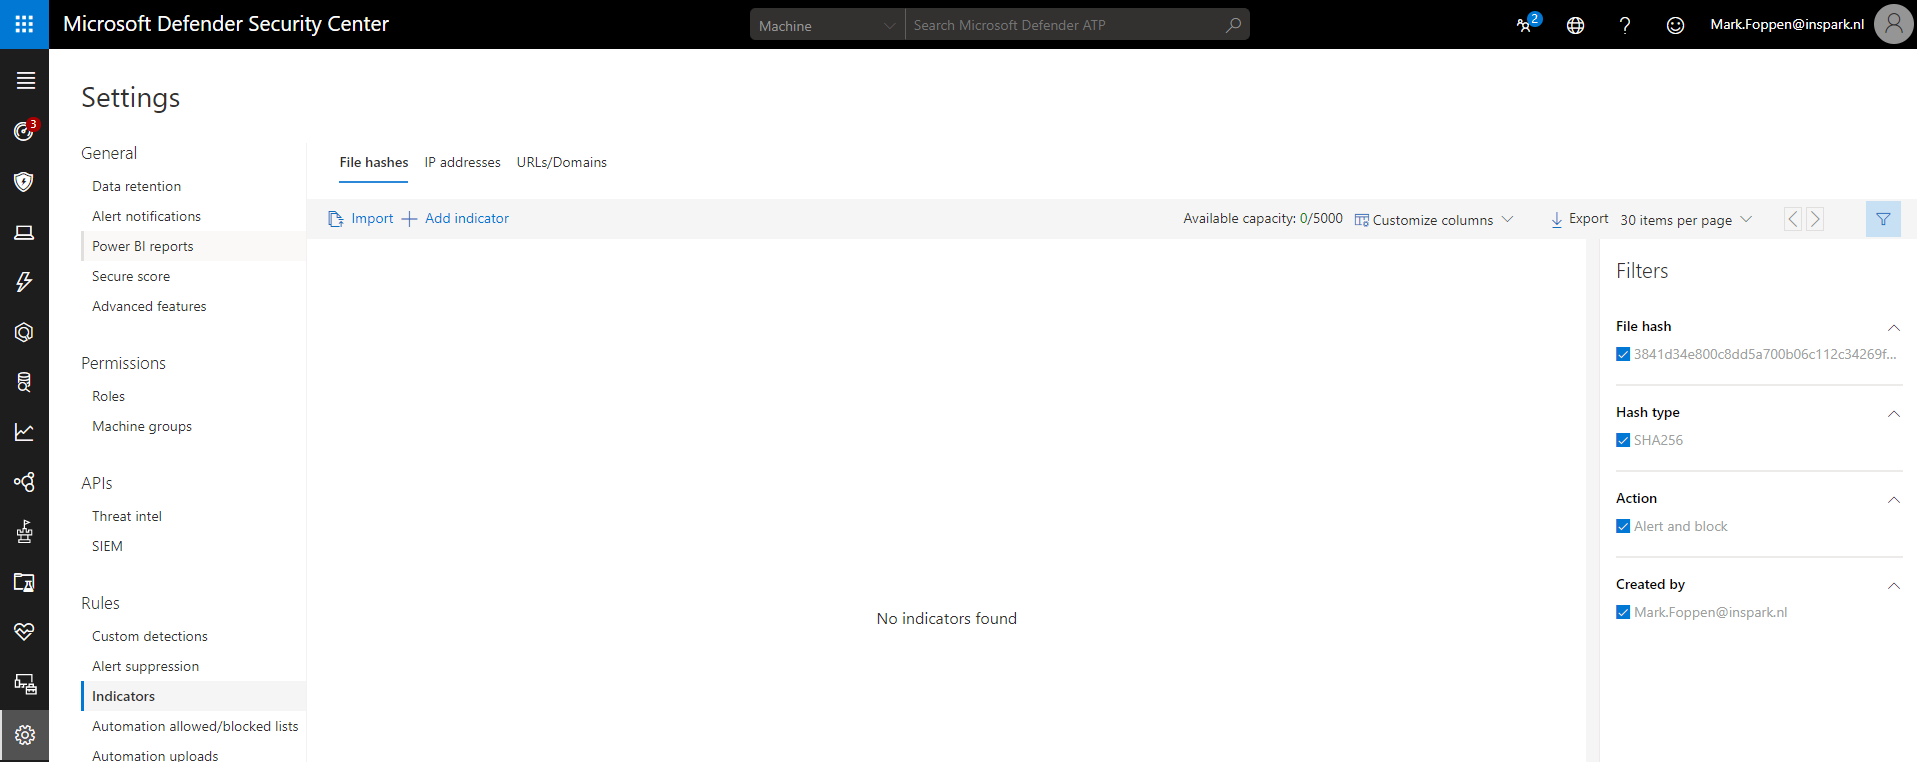
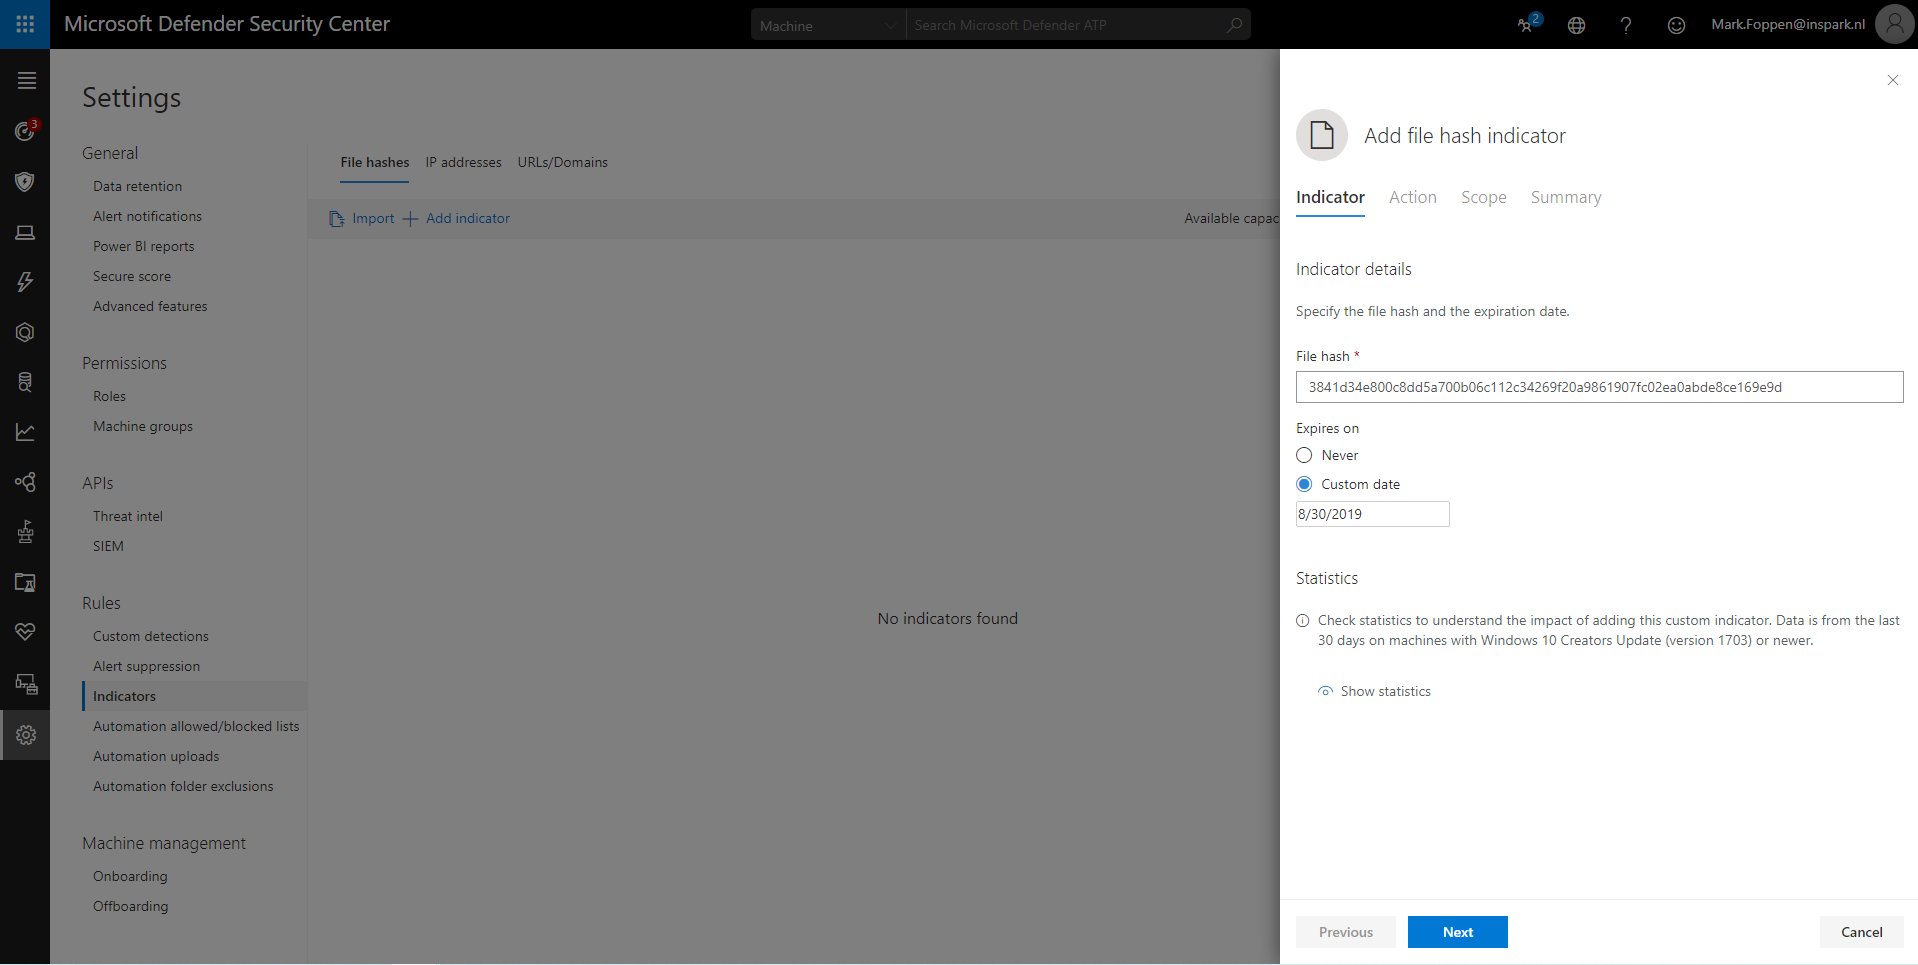
By clicking on +Add Indicator we can add a new indicator manually. Here you must give the file hash which can be a SHA1, SHA256 or MD5. For now, there is a limit of 5000 indicators at the time of writing this post. By setting the expiration date you automatically clean them up.
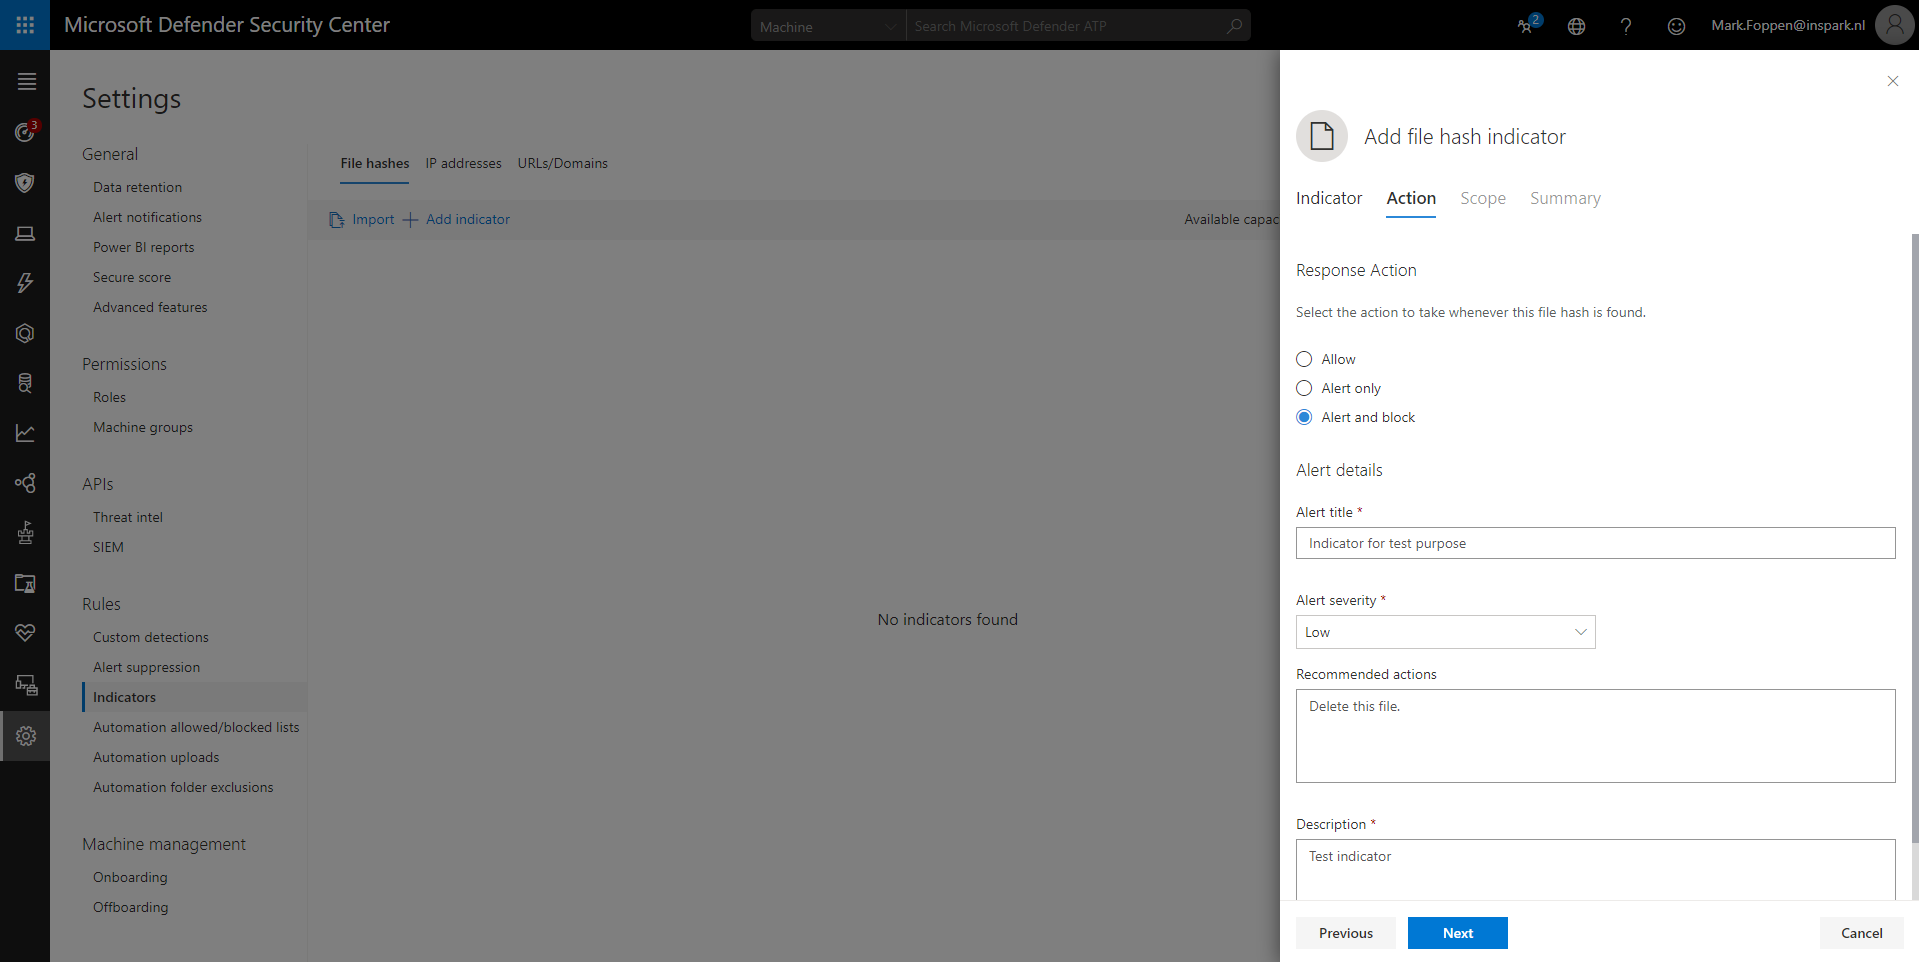
When you go to the next step in adding an indicator you must determine the actions MDATP should take when there is a file with the same hash. We have 3 possible actions:
- Allow
- Alert Only
- Alert and Block
Allow is used when MDATP is already blocking a file or executable that you do not want to be blocked. Take for example Mimikatz, if you put the file hash of that in here you can use the program without MDATP putting it in quarantine.
Alert Only is used when you only want to receive an alert that the file is detected but not want to block it. If you can post the Alert yourself you should not be using this. Instead use the MDATP API (docs here) to create the alert. This way you won’t be using another spot on that 5000 entries limit.
Alert & Block is used when you immediately want to block the file on all or scope of machines. Be very careful with this option. If a critical windows file ends up here it will have an impact on your organization.
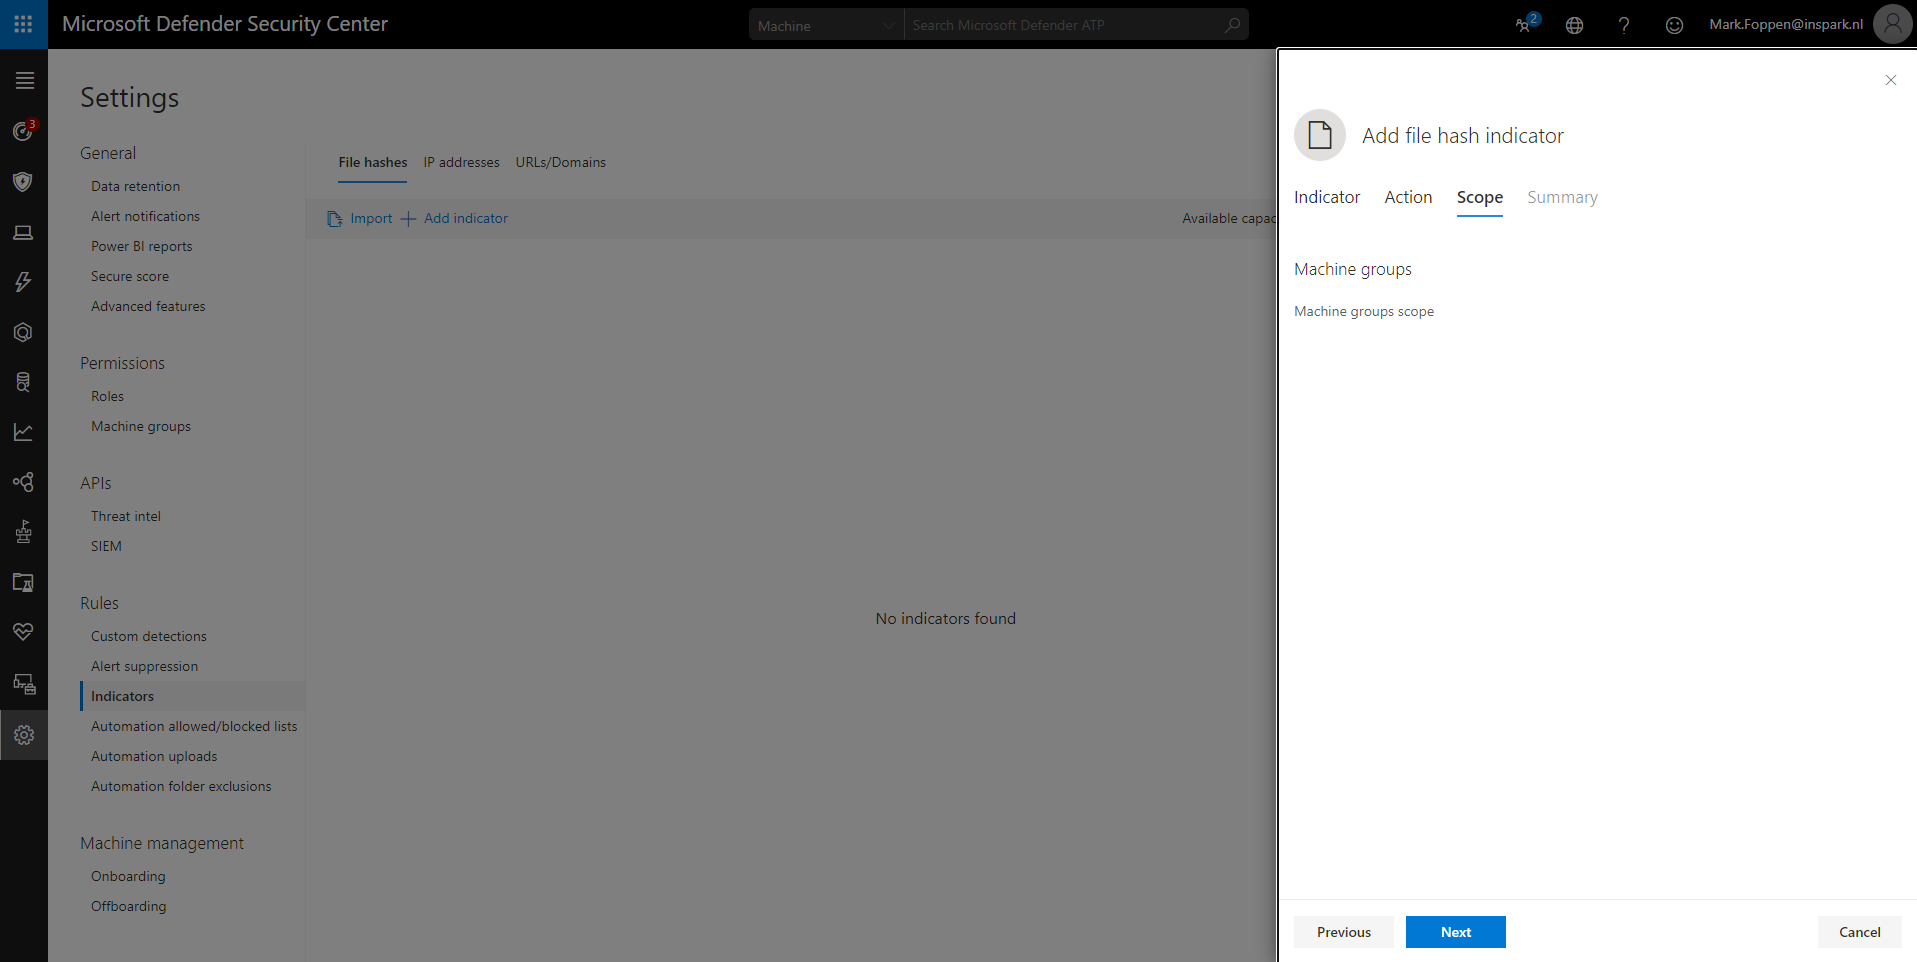
The 3rd and last page is to set the scope of the indicator. In the screenshot below you don’t see any scope since I don’t have any. The scope can be set to a determined list of machines or all machines in the organization.
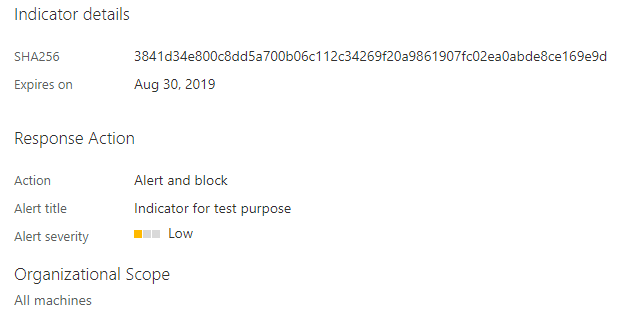
The last step is the summary to make sure you didn’t make a mistake and double-check your input.
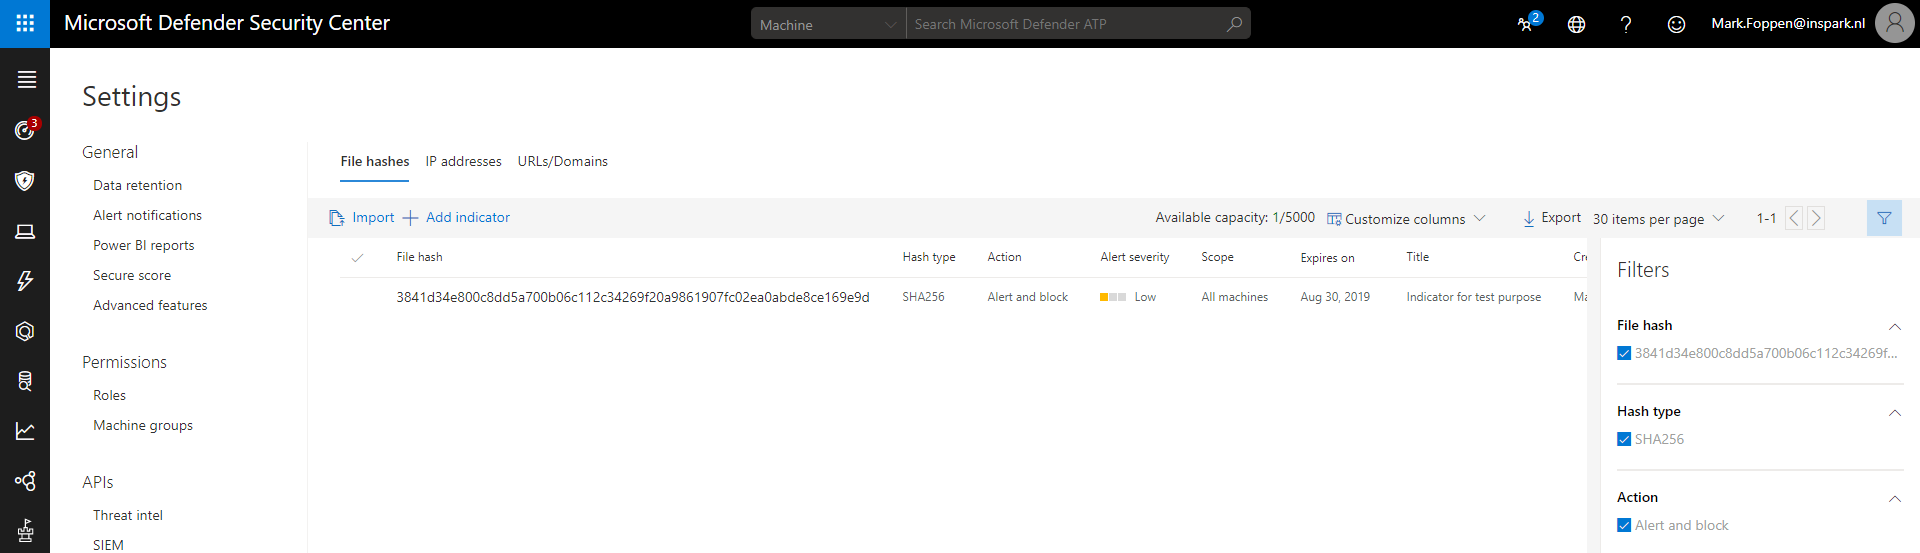
After we completed these simple steps you will see the indicator added to the list.
Add Indicators through the Microsoft Graph Security API
Now that we have a good understanding of what threat indicators are and how they are working, we can start adding them to Azure Sentinel. Why would we want to add them to Azure Sentinel? Azure Sentinel is a very good product to correlate security events across different log sources and different Microsoft security products.
Make sure that the Threat Intelligence data connector in Azure Sentinel is enabled.
To add the indicators to Azure we are using the Microsoft Graph Security API (beta). Before we post a new indicator we need to set some properties first:
- Action: Alert, only give an alert, do not block the file.
- FileHashType: SHA256, in this example we only process SHA256 hashes to keep it simple
- FileHashValue: The actual file hash
- ExpirationDate: When will the indicator expire
A basic post message would look something like this:
{
  "action": "alert",
  "activityGroupNames": [],
  "confidence": 0,
  "description": "This is a canary indicator for demo purpose. Take no action on any observables set in this indicator.",
  "expirationDateTime": "2019-03-01T21:44:03.1668987+00:00",
  "externalId": "Test--8586509942423126760MS164-0",
  "fileHashType": "sha256",
  "fileHashValue": "b555c45c5b1b01304217e72118d6ca1b14b7013644a078273cea27bbdc1cf9d5",
  "killChain": [],
  "malwareFamilyNames": [],
  "severity": 3,
  "tags": [],
  "targetProduct": "Azure Sentinel",
  "threatType": "WatchList",
  "tlpLevel": "green",
}
To keep it simple you can either post this to the Graph Security API with postman or by using an Azure Logic App as I did. Your Logic App Http step will look similar to below:
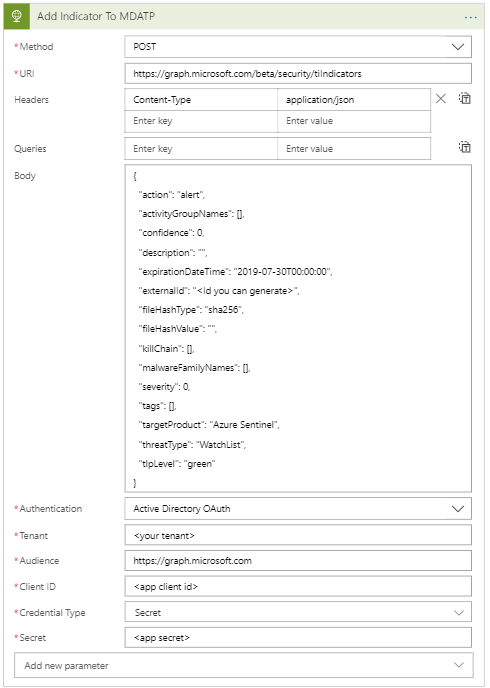
In the logic app, you see a client id and client secret. These are from the application registration and you can have a look here how you can set that up. Keep in mind that your application needs the permission ThreatIndicators.ReadWrite.OwnedBy for the request to work. This permission needs to be granted by a global administrator in your tenant.
Did you notice the targetProduct property set to Azure Sentinel? This is what specifies where the indicator is redirected to.
After a successful post, you can view the indicator in the Azure Sentinel dashboard. This can be done by going to the ThreatIntelligenceIndicator log source
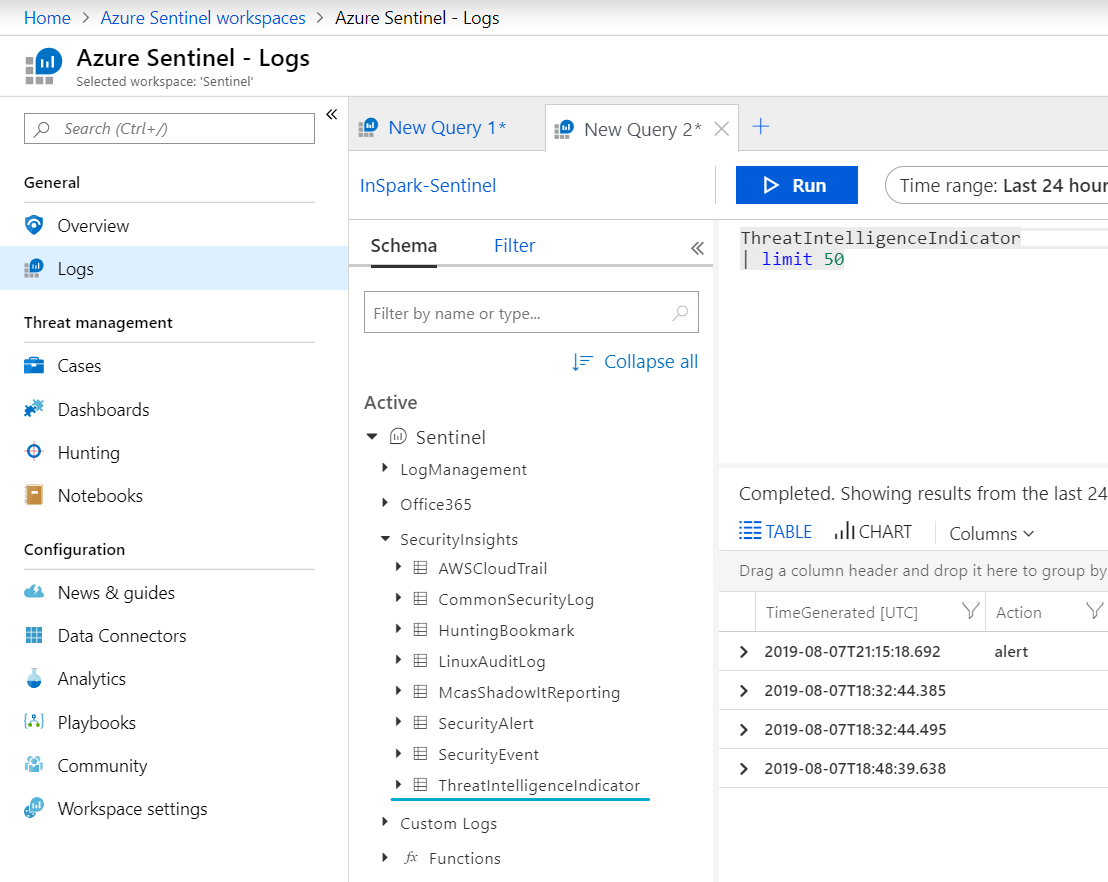
When you query this you will get something similar like below, depending on how many indicators you posted.
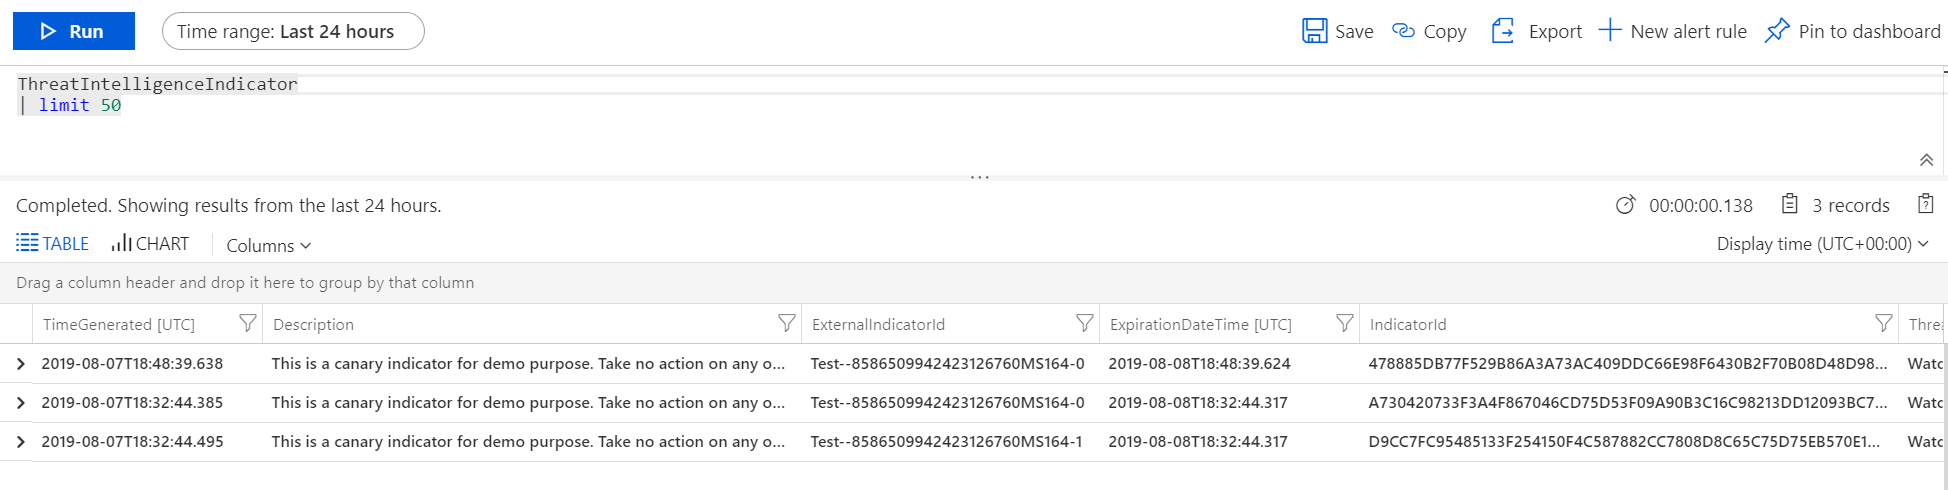
It is re[mark]able how easy it is to add indicators to MDATP and Azure Sentinel, but yet so powerful. Now you can leverage the data of indicators in Azure Sentinel alerting, correlation and hunting.
Thanks for reading!